
Good morning!
At the Uncertainty Project, we explore models and techniques for managing uncertainty, decision making, and strategy. Every week we package up our learnings and share them with the 2,000+ leaders like you that read this newsletter!
In case you missed it, last week we wrapped up a three part series with the third and final post on competition and strategic decisions.

Are We Gonna Win?
Tracking Uncertainty with Win Probability Charts
Over the last decade or so, we’ve seen a new chart appear during games in different sports. The “Win Probability” chart seemed to come out of nowhere, and put probabilistic thinking in front of the sports fan.
As a fan, we know when things are going well, and when things aren’t. But putting numbers against that? Numbers that confirm when a win is “in the bag” (i.e. it’s better to go outside and enjoy the day)? Or when it’s time to give up (i.e. no hope for a comeback)? Well, now that’s kinda interesting.
The most exciting games tend to have wild swings in win probability. The all-time classic might be the 2021 AFC Championship Game (in American football), between the Kansas City Chiefs and the Buffalo Bills:
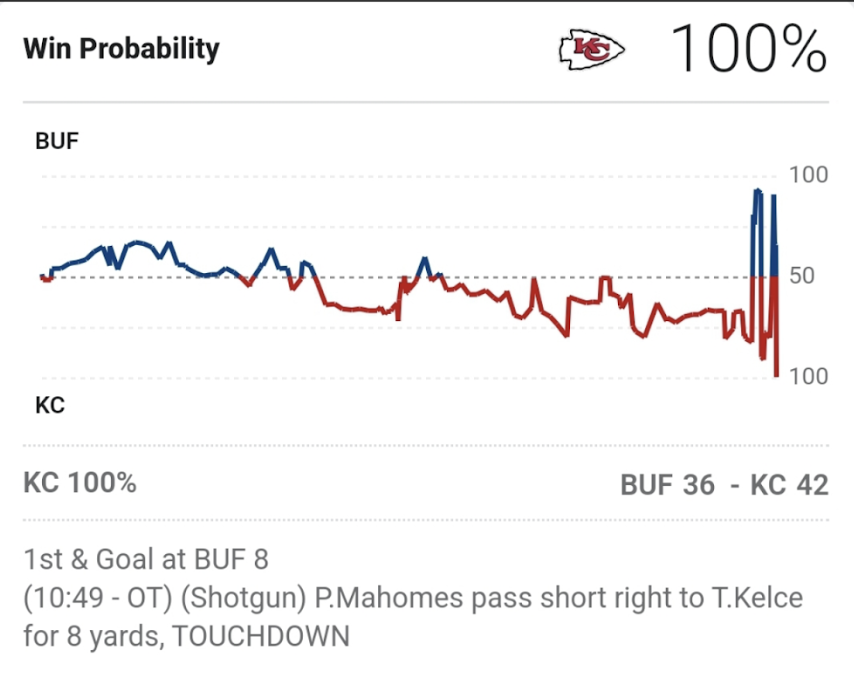
As the game finsihed and went into overtime, the two teams traded scores, and each team was on the cusp of winning multiple times. But the Chiefs had the ball last, and that produced the win (and a rule change for the next season).
These charts can also document the emotion of the game, over time, for hard-core fans. As a die-hard Chicago Cubs fan, I know exactly what was happening (and how I felt) for every last wiggle in this chart of Game 7 of the 2016 World Series:
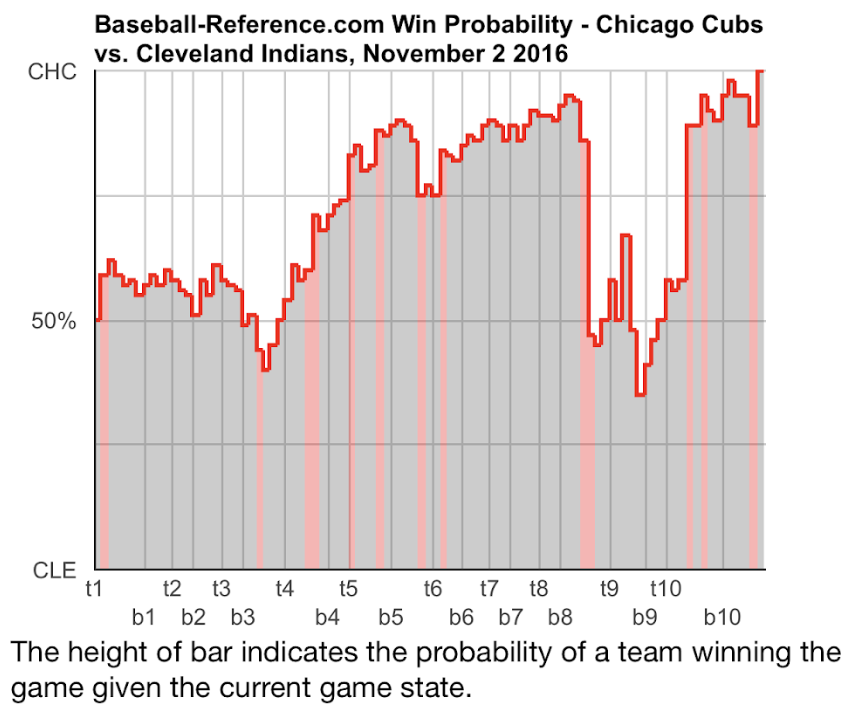
From the leadoff home run pushing us up above 50% (at the start), to the heady, excited advance of “this can’t be happening, is this really happening?” (through the middle innings), to the gut punch of the game-tying home run in the eighth inning… this accurately tracks the changing moods and anxieties of the (committed) fan.
So, what if… we could get a view like this, of how an individual project is trending, towards our defined aims, based on equating “winning” with success in a project’s hypothesis?
Could we monitor a “win probability” for each project across our full list of active projects? And, eventually, could we instrument a “win probability” chart for the winning aspiration driving our strategy?
What might that look like?
For a given strategic initiative (i.e. project), we could watch how the initiative’s hypothesis is trending over time: that is, the probability of whether it will prove it to be “true” (100%) or “false” (0%), as new information, new insights, and new learnings emerge.
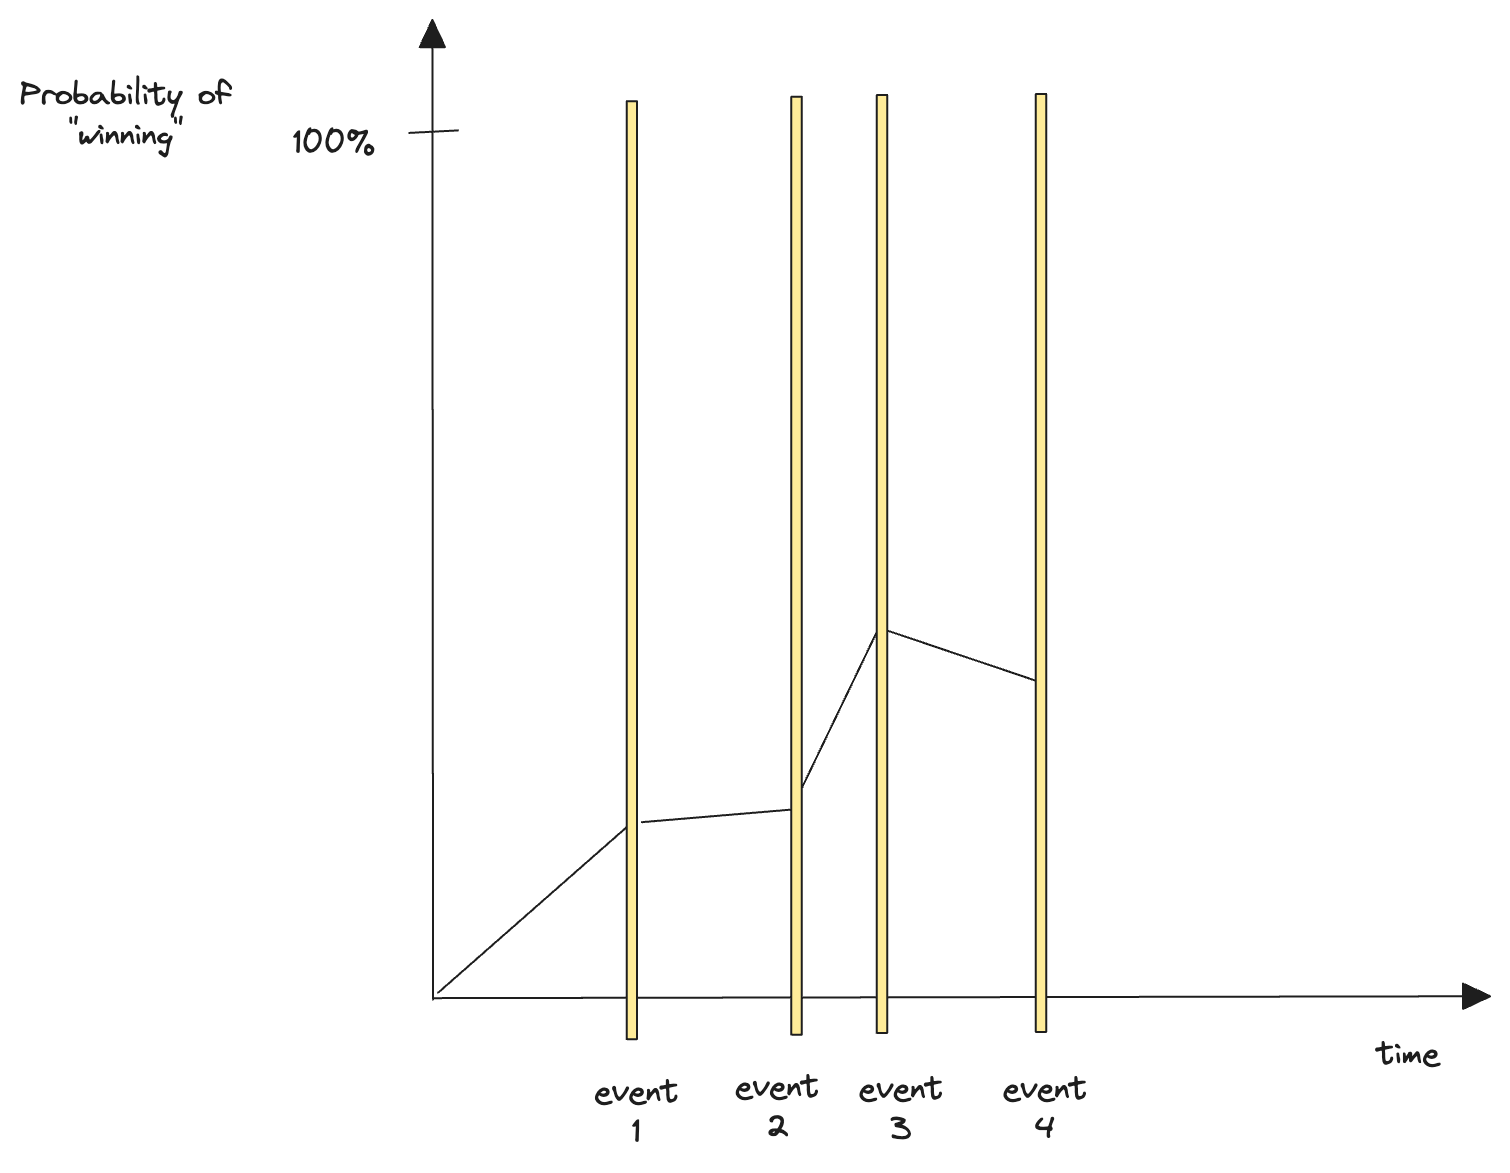
We call these new insights “events” and we could (in advance) assess the likelihood of these events happening. So we would start by creating some prior “beliefs” about these (planned) “events”, then continuously assess whether what we observe should challenge those beliefs.
The strategic equivalent of the Cubs-Indians game might be where the organization overcame some early feasibility challenges, moved steadily towards a “win”, but encountered some late surprises closer to deployment or even afterwards. [You can see how the “end of the game” would really depend on your chosen definition of “winning”...]
The strategic equivalent of the Chiefs-Bills game would be one where some very late insights (e.g. when customers interact with some delivered change in unexpected ways) shake up our chances of “winning”. Maybe the parallel here would include a dramatic pivot, in response to this late insight, to reclaim the “win” with a great adaptive move.
And to state the obvious, for a project, we are competing not with a direct competitor, but with all possible outcomes, given the constraints of our systems and contexts. But the concept of “winning” is still there, and still an important concept for strategy.
So what would we need, to introduce a “win probability” view into our strategic efforts, to support tracking, across our portfolio of projects?
What this would take:
Complementing existing elements with attached beliefs that gauge uncertainty
Connecting beliefs when one is built on assumptions about another
Assessing the likelihood of each belief being “true”
Refining the likelihoods for conditional (related) beliefs
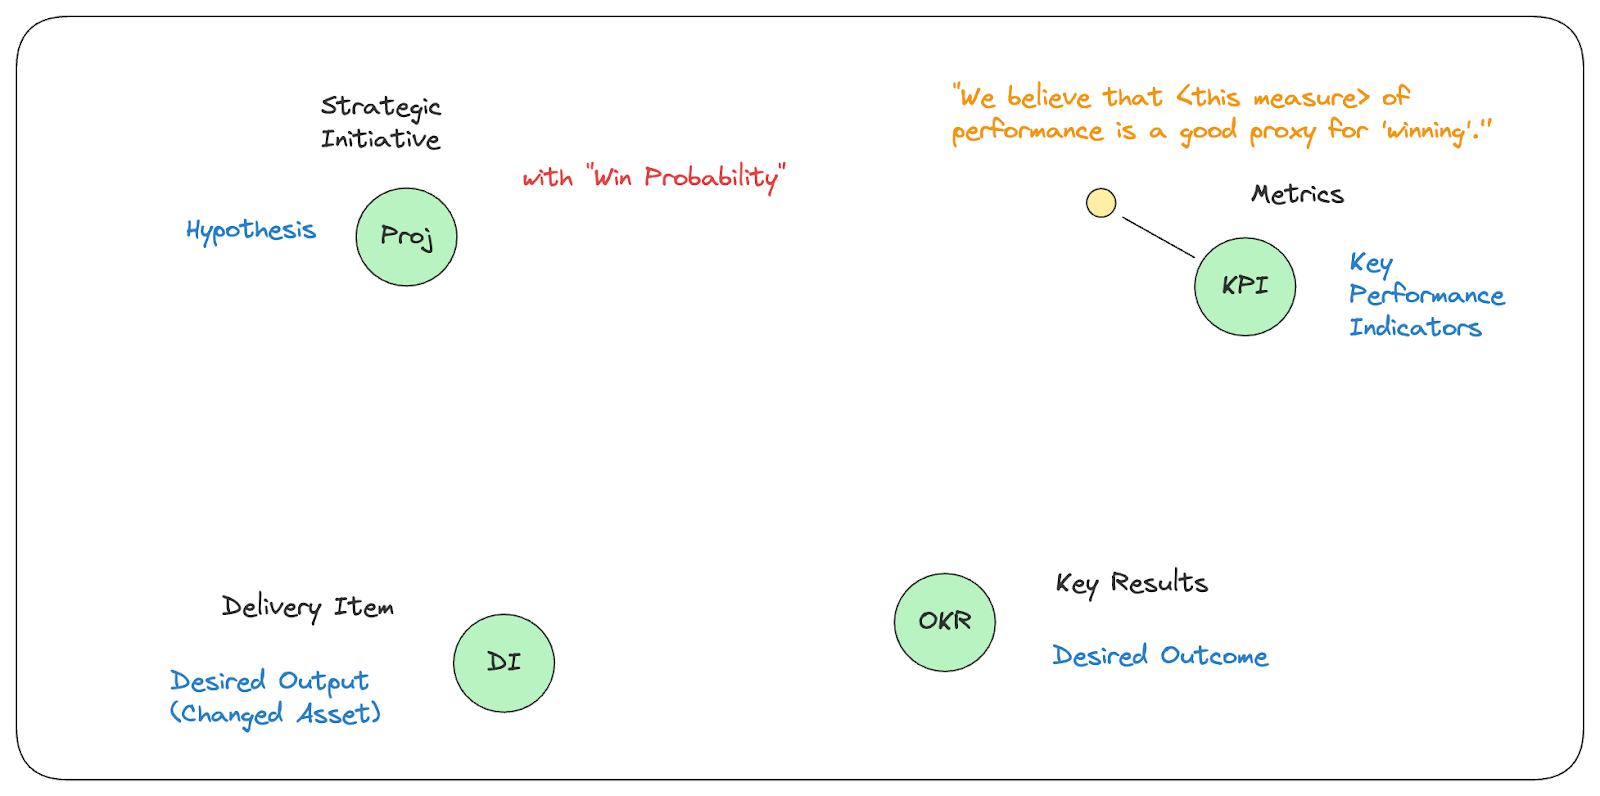
Let’s walk through a typical enterprise context, one that has an operating model built on these four elements:
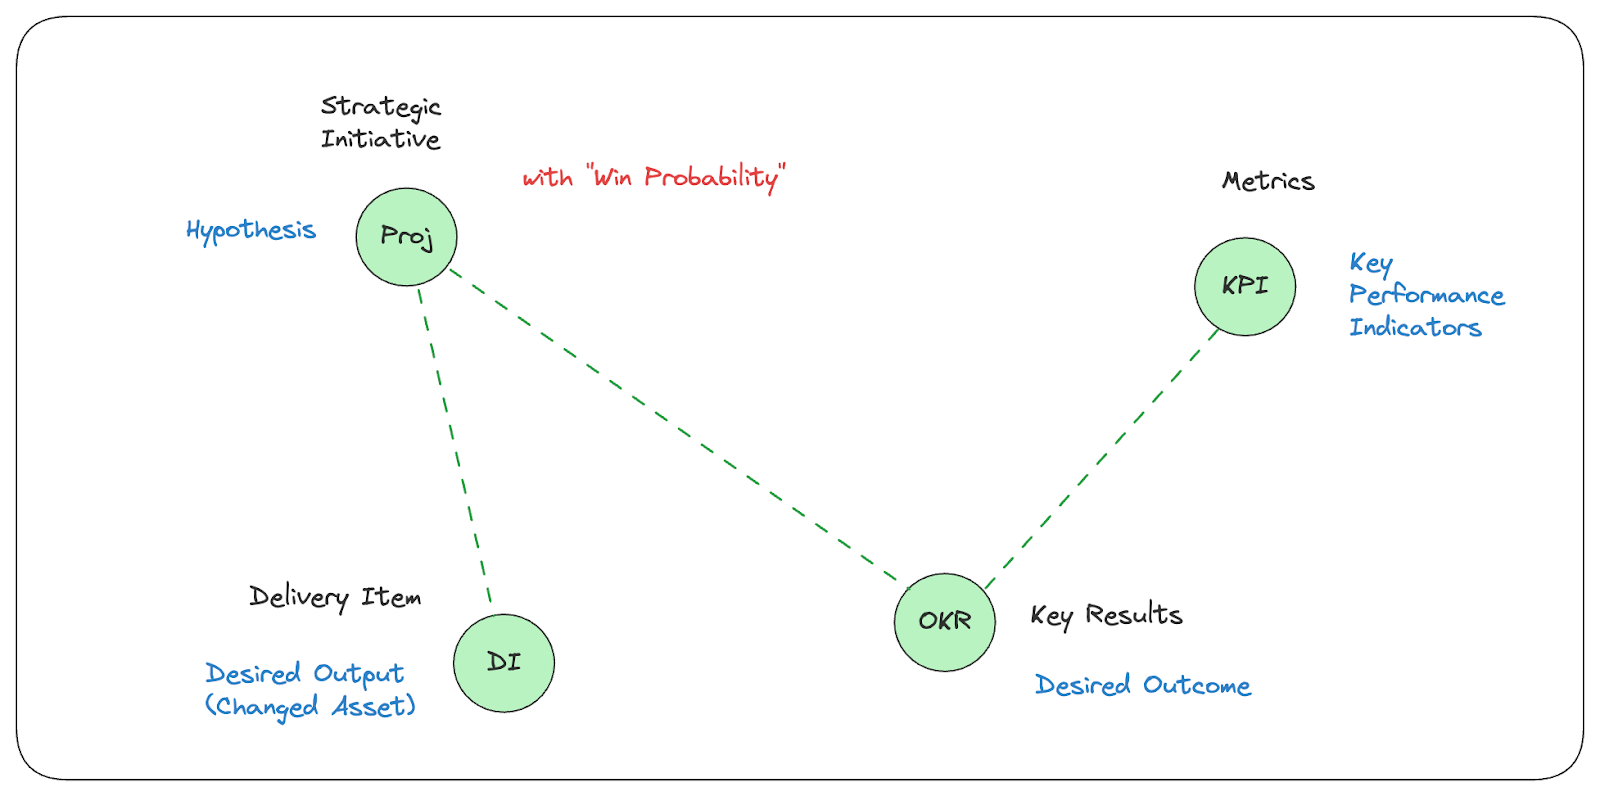
Strategic Initiative
For now, we choose the scope of a project to be our “game”. These are the hypotheses that we fund, to drive changes and chase good opportunities. We want to craft a “win probability” chart for each project. We say a project “wins” when its hypothesis is validated.
Delivery Item
This is our desired output. This is something that we create, incrementally in pursuit of the opportunity framing the project. It could be a new feature for a product. It could be a new menu item in a piece of software. These things are often modeled as JIRA epics or something similar, to show on roadmaps to customers. The delivery items should be something a user or customer can understand. [Note that while we build out this example with just a single delivery item for the initiative, there will likely be multiple delivery items shaping the outputs for the initiative.]
Key Performance Indicator
This is our “scoreboard”. We choose metrics that “matter” for our strategic aims. These are what we choose to track, as the “metrics that matter” for the organization. They are always context-specific. They proxy for our performance in some way. If our performance is good, the metric should look good.
Key Results
This is our desired outcome. With a set of KPIs in hand, we can measure our current levels, and choose target levels to pursue in the future. These quantify the target destination for our goals and objectives. These become part of our quarterly or monthly goals (perhaps OKRs). The hypothesis of a project or initiative should reference key results in its validation criteria. [Note that while we build out this example with just a single key result, there will likely be multiple key results collectively shaping the desired outcomes.]
Next let’s introduce a complementary belief for each element, that can be used to gauge the uncertainty present.
Key Performance Indicator
When we choose our metrics, this is based on a belief that it is a good proxy for success. We believe that focusing attention on what can “move the needle” will lead to good results. We can make the uncertainty around this choice more visible by explicitly attaching a belief to the metric.
“We believe that <this measure> of performance is a good proxy for ‘winning’.”
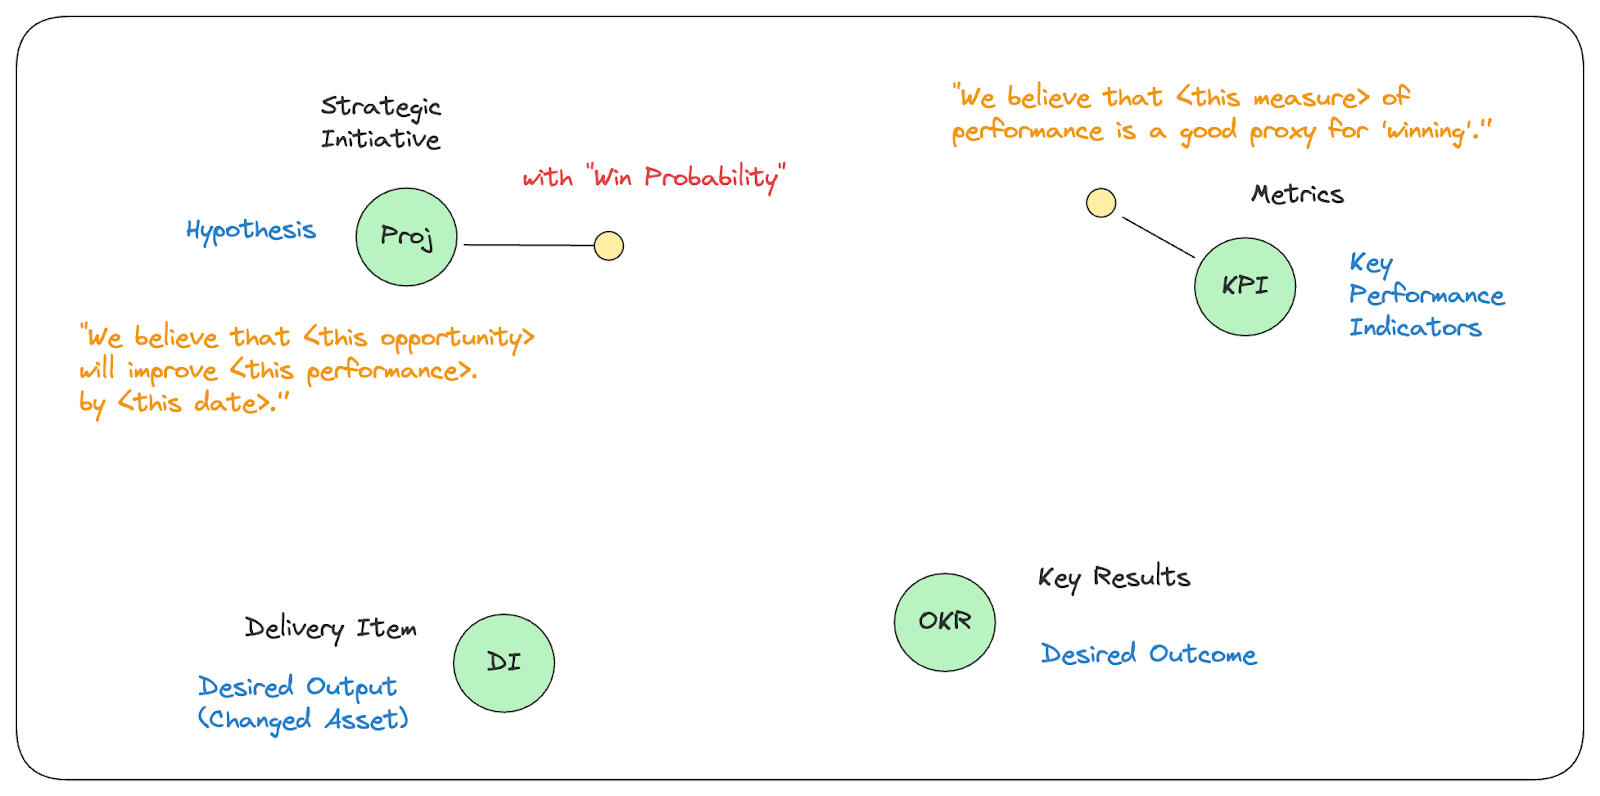
Strategic Initiative
The projects we define and choose to fund carry uncertainty in their premise. We often try to capture assumptions and risks with the project, to make some of the uncertainty more visible. But when we frame the project or initiative as a hypothesis, this experimental mindset makes it easier to attach a complementary belief that makes the risk more tangible.
“We believe that <this opportunity> will improve <this performance> by <this date>.”
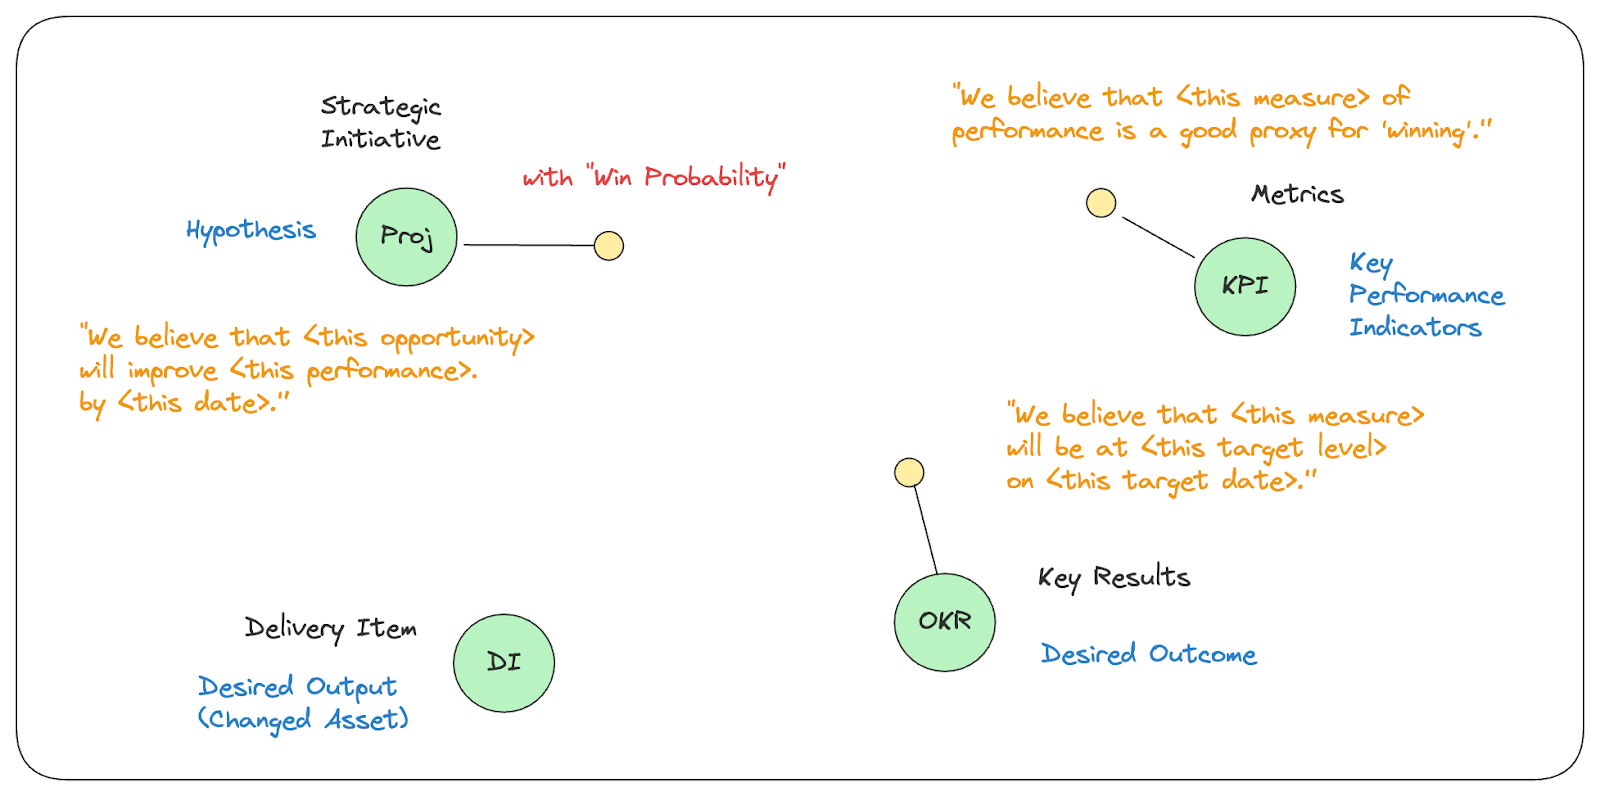
Key Results
Like the project or initiative, our key results describe a change that we expect to see happen within a specified timeframe. As we know, it’s often the timing that brings the most uncertainty to the table. Some goals are easier than others. Some are more aggressive with their timing. We can attach a complementary belief to convey our thoughts on the likelihood of achieving the goal.
“We believe that we can achieve <this target level> in <this operational metric> by <this date>.”
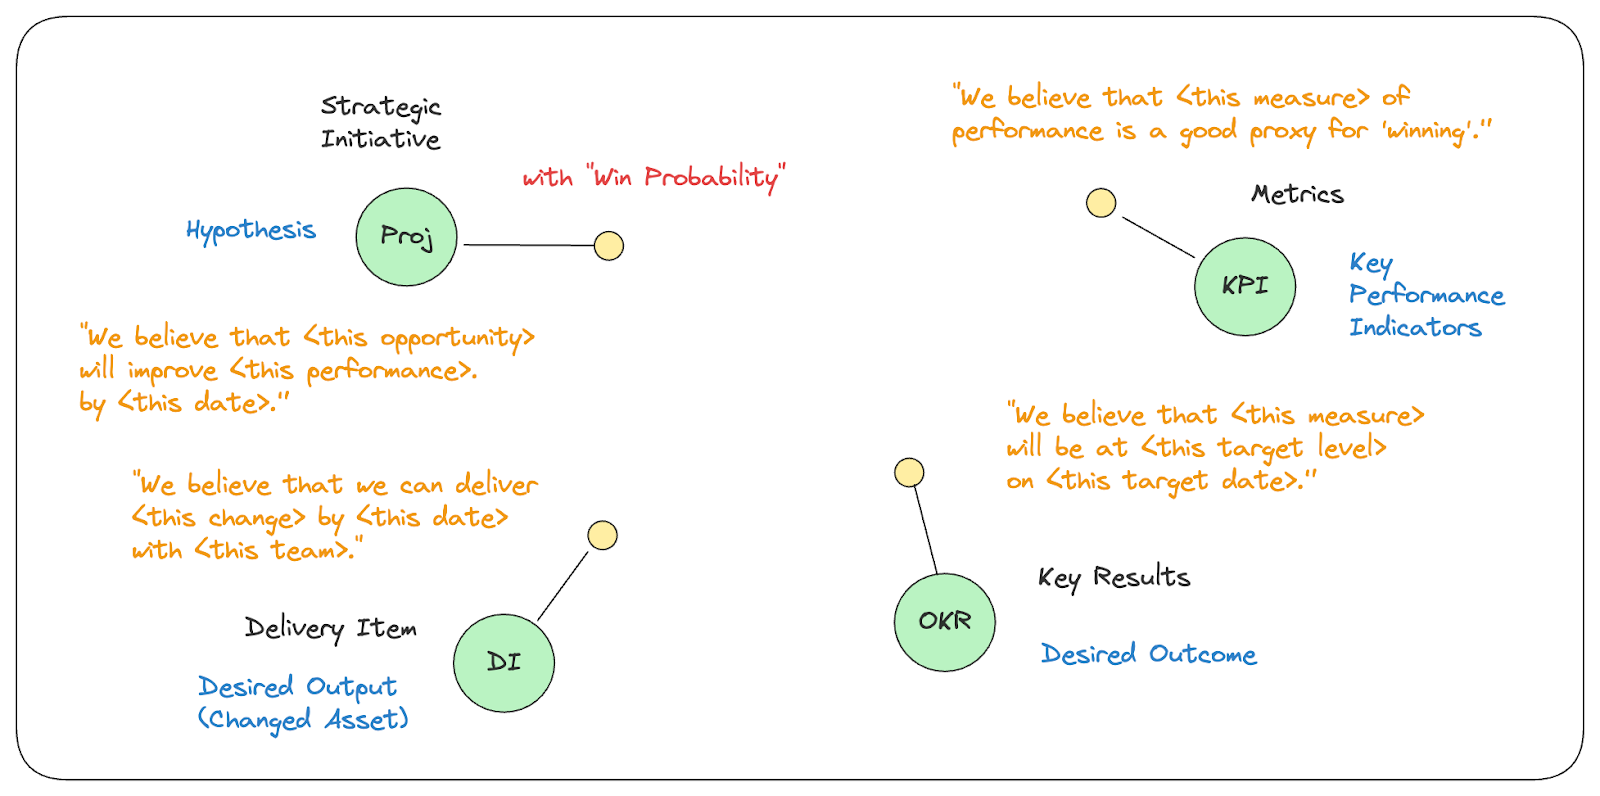
Delivery Item
Before the “needles” can move on our metrics, we need to produce a change in one or more assets. This is the implementation and execution behind the project or initiative; it’s the work of the teams. Questions of feasibility can drive uncertainty here. Issues with prioritization can drive uncertainty here as well. Team capability is another factor, etc. We attach a belief to a JIRA epic (or equivalent) to make the uncertainty in its success more explicit.
“We believe that we can deliver <this change> by <this date> with <this team>.”
Assessing the Likelihood of a Belief being True
So now that we’ve introduced some attached beliefs, we can spark a dialog to gauge the uncertainty for each one.
For example, the belief we attached to the project can be evaluated as a probability that the belief statement is TRUE:

If I provide an estimate that a given belief is only 40% likely, I should follow that up with some reasons why. People might agree or disagree with these reasons, but the dialog will be exposing “uncertainty that matters,” which is a definition of risk.
For this reason, it’s great to involve a group of people when assessing the probabilities of specific beliefs. They can bring different perspectives, experiences, and different details of the “ground-truth” to the exercise.


This assessment can initially be done for each belief, independent of the others, but pretty quickly, their inter-dependencies will surface in the conversations.
Connecting Beliefs
So while healthy dialog is one by-product of making the beliefs explicit, another is the way it exposes how one belief may be contingent, or have some relationship, to another belief. [Think of it as dependencies across the beliefs, if you’d like.]
We begin to say things like, “I believe <this thing> is likely, because I also believe this <other thing> is likely.” It also drives the corollary: “But if the <other thing> becomes less likely in the future, I’d like to revisit my confidence in <this thing>.”
These relationships or dependencies are what can form a belief network. Judea Pearl described a relationship between two beliefs as one belief “listening” to another, which clarifies it as a loosely coupled, and somewhat mysterious, relationship.
Sometimes, the amount of “listening” taking place is stronger. That is, our opinions about a particular belief are very much influenced by some other belief.
We capture these relationships in our belief network diagram:
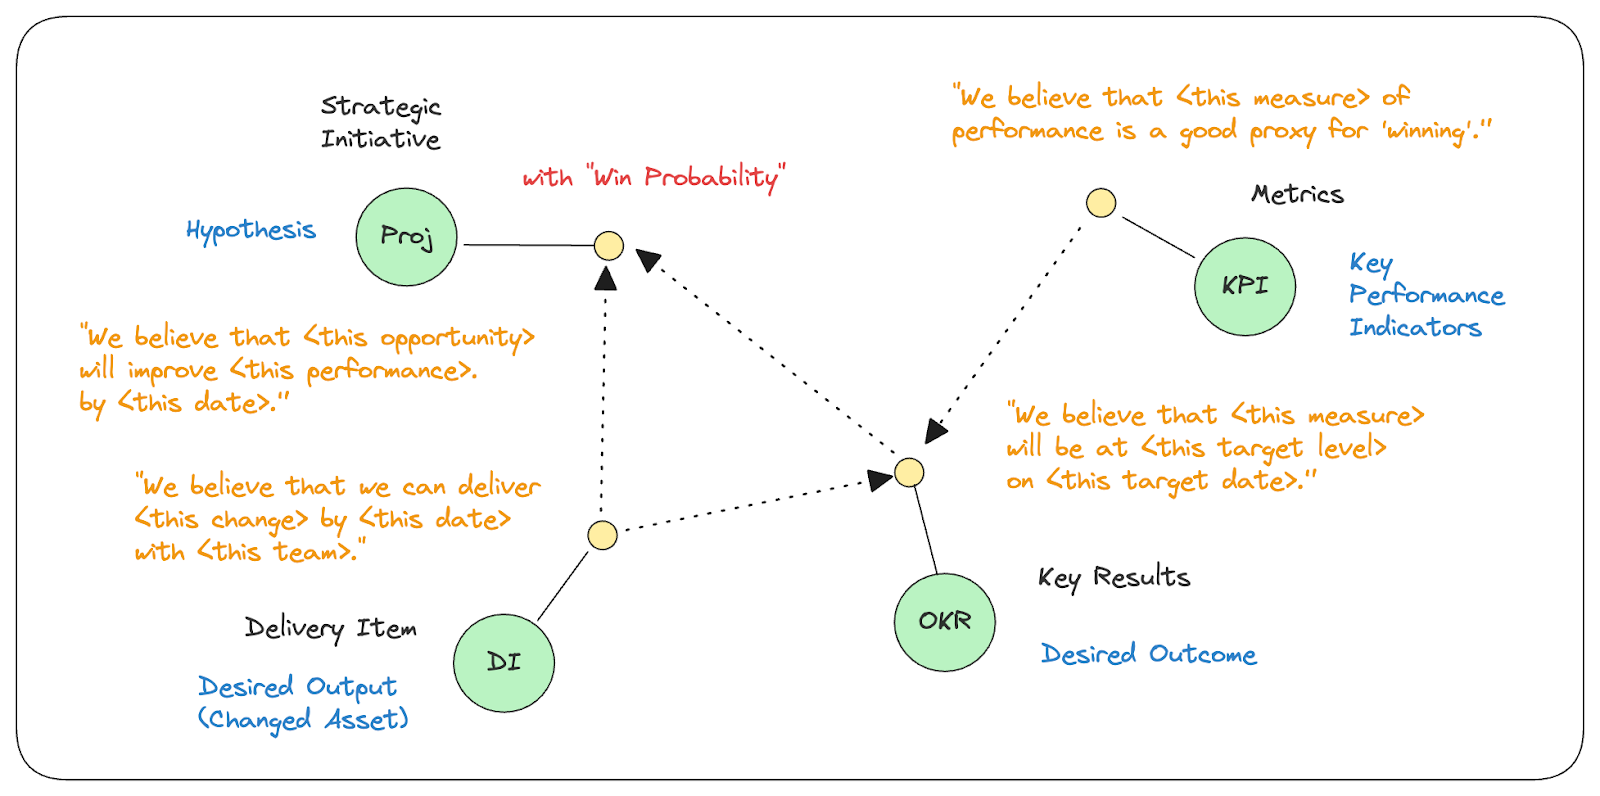
Here we find the “listening” relationships by moving backwards across the arrows:
Our Strategic Initiative belief “listens” to our Key Results belief, so that uncertainty around achievement of desired outcomes can influence the hypothesis for the project.
Our Strategic Initiative belief “listens” to our Delivery Item belief, so that the uncertainty around the creation of outputs can influence the hypothesis for the project.
Our Key Results belief “listens” to our Delivery Item belief, so that the uncertainty around the creation of outputs can influence the uncertainty around meeting goals.
Our Key Results belief “listens” to our Metrics belief, so that the definitions of success can be influenced by the quality of the proxies for success.
So how does “listening” take shape? We know it means that our belief (in the listener) will vary based on the other belief (that we are listening to). We shape this, and quantify this, using conditional probabilities.
Conditional Probabilities
Now that we’ve identified the relationships that form our belief network, we need to refine the assessment of the likelihood (of beliefs being true), to reflect all this “listening”.
These were the assessments, taken independently.


But now we want to capture how our belief in the delivery item influences our belief in the key results.
Imagine that you are asked to move the slide bars below:
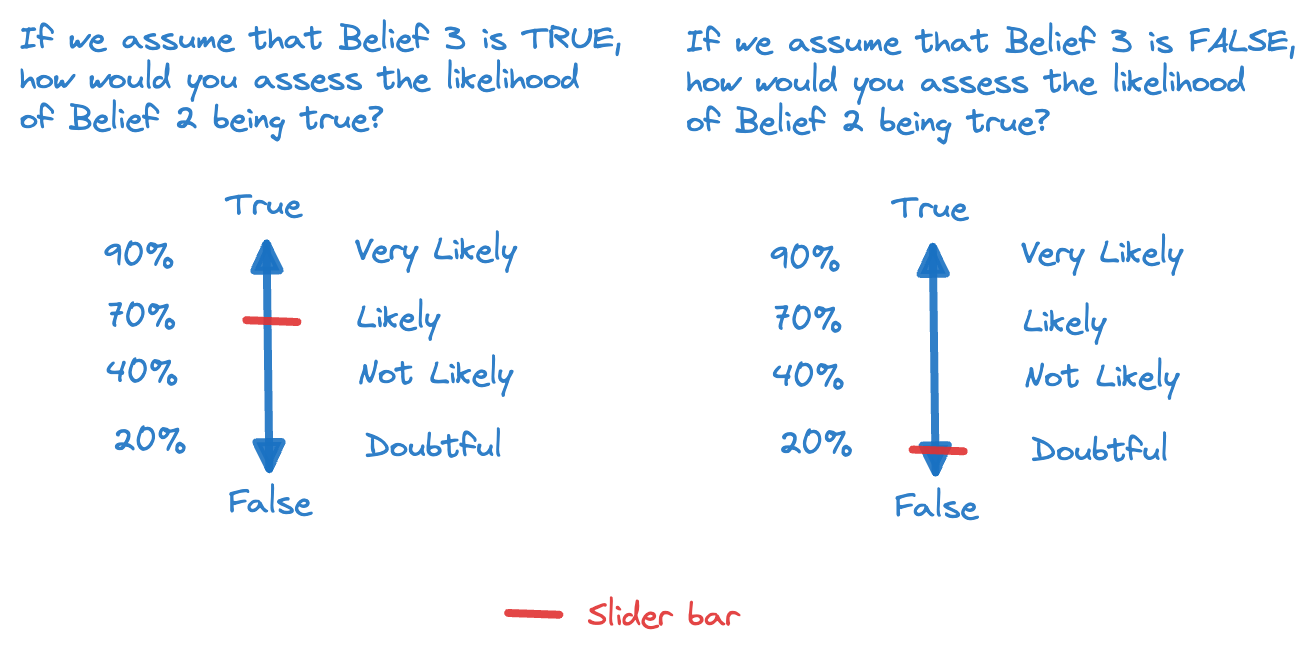
The sliders would produce a set of conditional probabilities:

This shows how our opinions about Belief 2 are “listening” to our thoughts about Belief 3. As our thoughts change (i.e. with new information), we can revisit these opinions to restate the conditional probabilities.
It also opens the door for a richer dialog about how dependent our current plans-of-record are on specific assumptions or beliefs.
For completeness, here are the rest of the probabilities, called “priors”, in our example:


Tracking “Win Probability”
For a given project, we will choose to define “winning” as successfully validating the hypothesis. [You can argue that there is also value in learning from an invalidated hypothesis, but hold that thought for now..]
So we establish, for a specific project:
Win Probability = % likelihood that belief (in hypothesis) is TRUE
When we set up a belief network, the combination of conditional probabilities set a baseline for our Win Probability (for the Project). In our example this is calculated to a baseline of 58.8%:
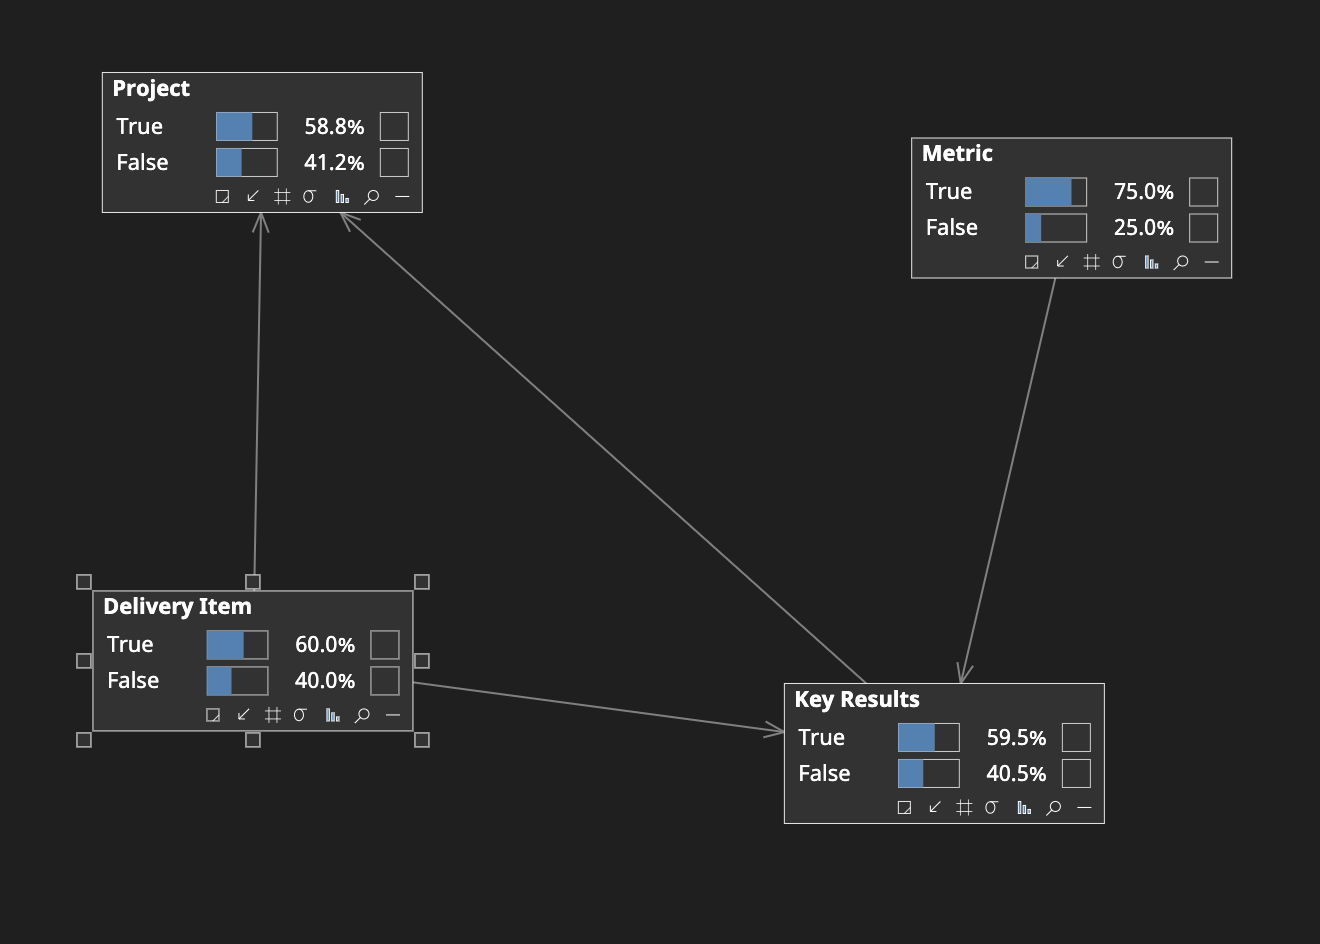
Example Belief Network (built with Bayes Server)
As we execute and progress, we mark when a particular belief is assessed to be “true” (as an “event”). For example, if we learn that Belief 3 (the Delivery Item belief) just proved to be true (i.e. we closed a JIRA epic), then we mark it as an event that has happened, and observe the calculated update of our “Win Probability” to 76.9%:
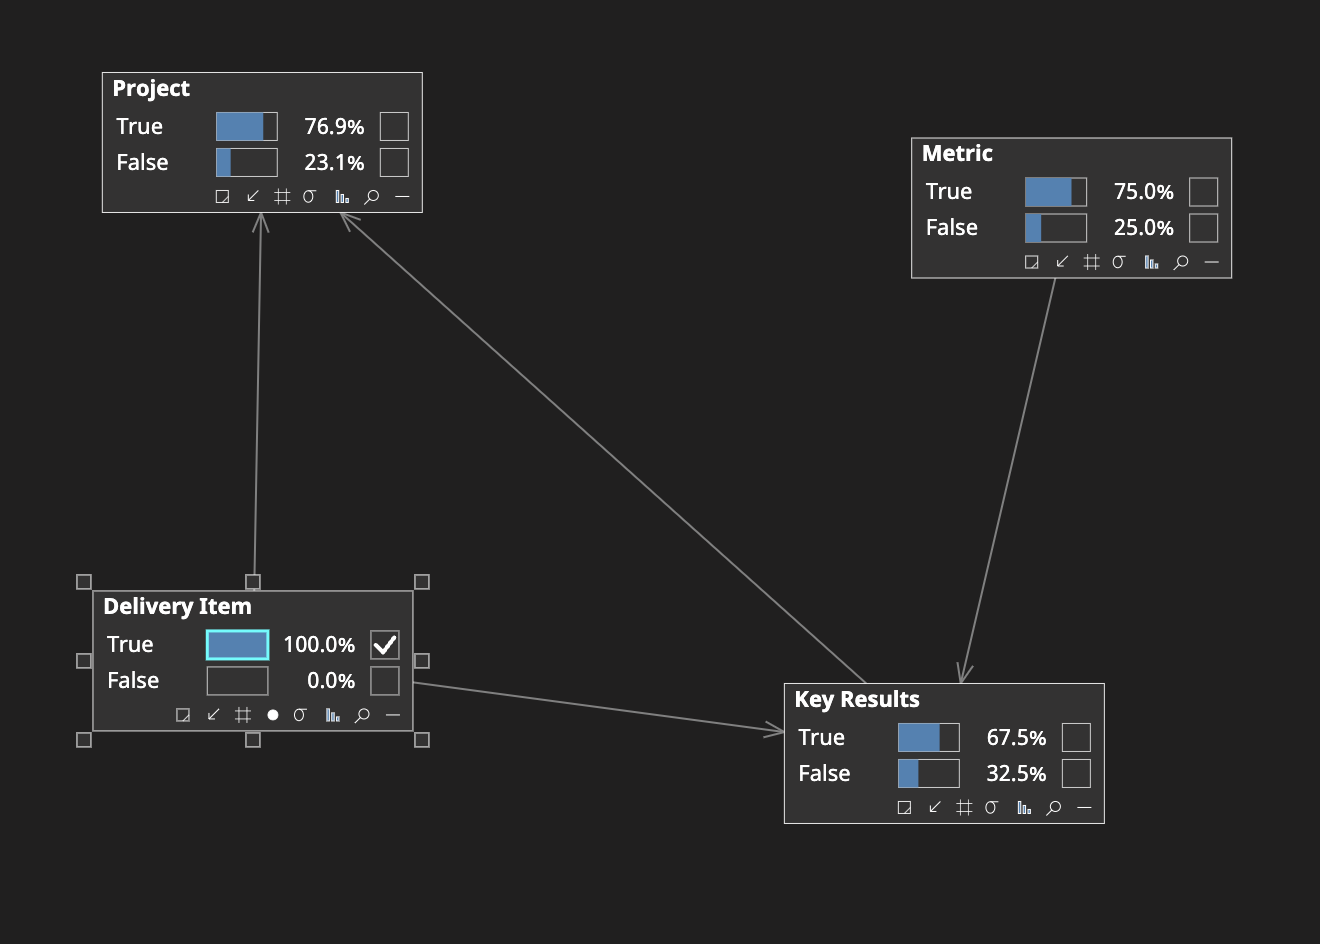
Example Belief Network (built with Bayes Server)
So we watch for events, and we watch for new information that might trigger a re-assessment of the conditional probabilities. This is the work of management: applying keen sense-making to the active model for “winning”.
Now let’s model that we achieved the quarterly OKR that our project was listening to. This event drives the win probability to 85.0%:
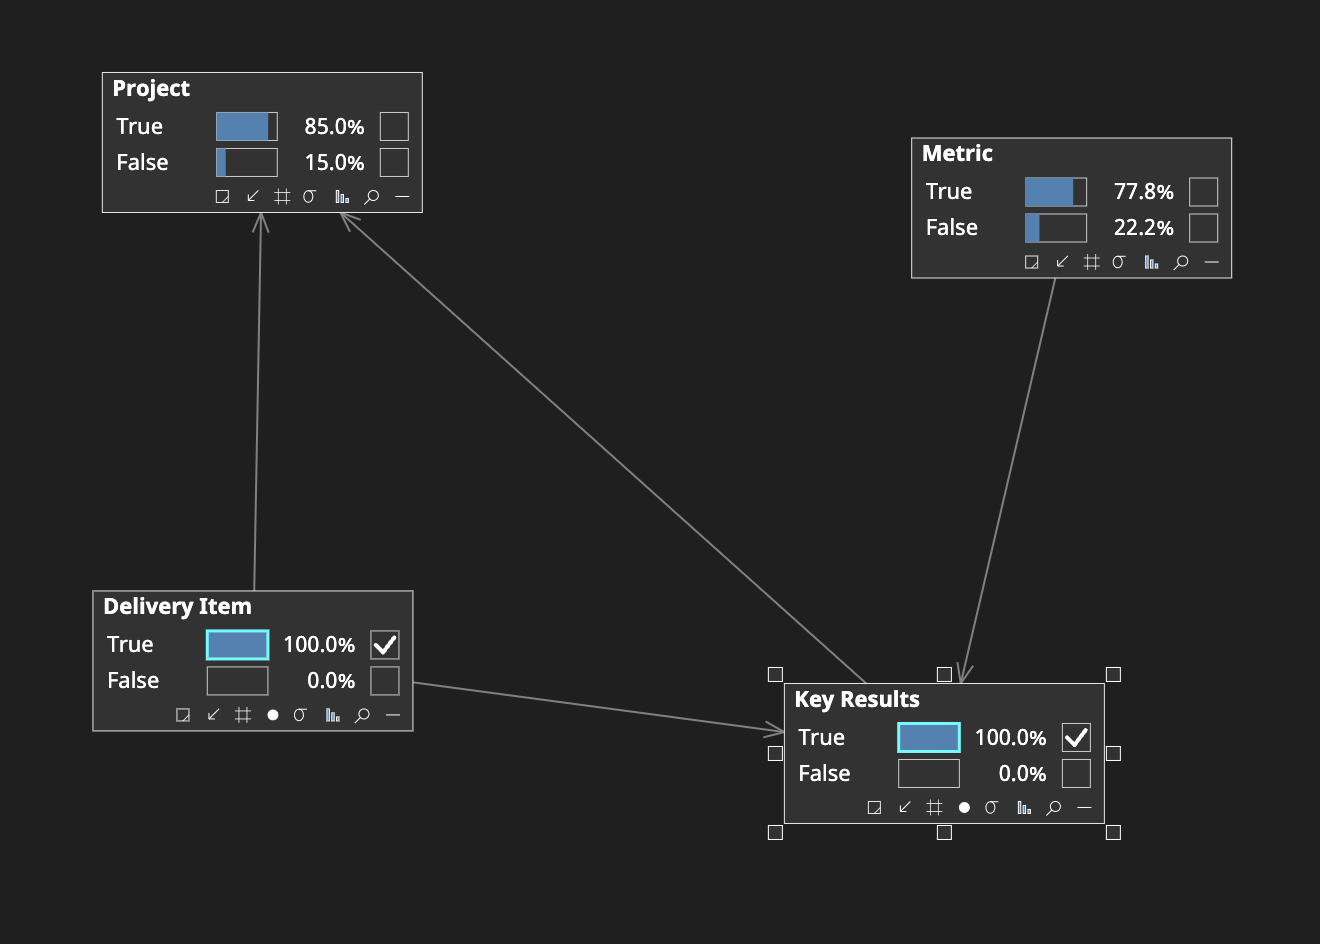
Example Belief Network (built with Bayes Server)
So as these updates emerge (as events) over time, we can watch the overall “Win Probability” change, as it is calculated across the belief network. When good things happen for a project, our “Win Probability” goes up, when bad things happen, it goes down. Also note that while we only show a single Delivery Item and a single Key Results belief in this example, there would likely be more than one helping form the belief network for a project.
New information can make us want to change the conditional probabilities across the network, and this also can drive the “win probability” up or down.
The trend-over-time of the likelihood of the belief in the project hypothesis becomes our Win Probability Chart:
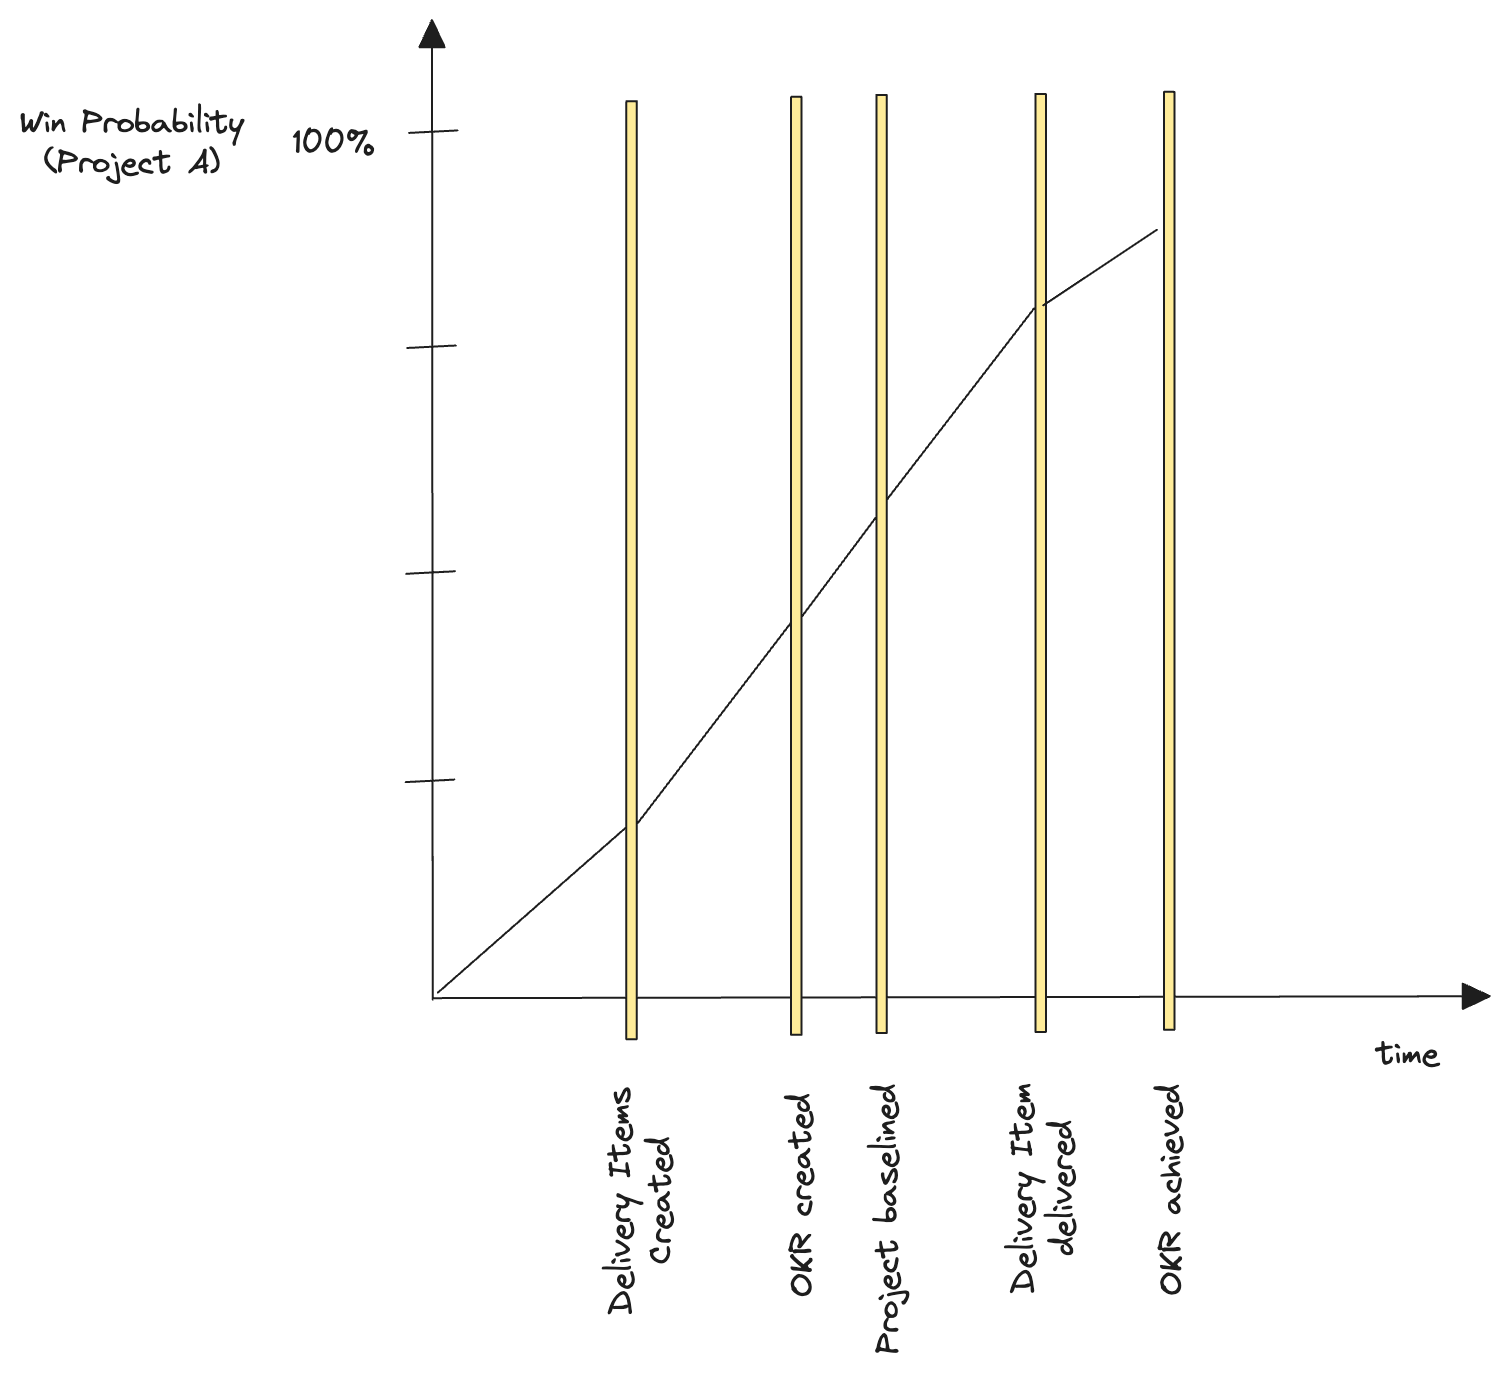
At the end of the day, a win probability chart would be for communication - it’s a tool that help drive dialog about the relative risks, across active projects.
Leveraging Win Probability in Portfolio Management
If you’ve got a “win probability” for each of your active initiatives, trending over time, then you can more effectively manage the set of initiatives as a portfolio. The portfolio manager’s job is to track risk and make changes in the portfolio composition to maximize the returns across the full set.
Win Probability Charts can help portfolio managers drive changes in response to trends in specific projects’ win probabilities.

Example Project Portfolio
And a portfolio manager could aggregate the Expected Value (EV) by Program, to compare to expectations:

Project Portfolio, viewed by Program
As a starting point, think about how you can introduce beliefs as a complementary, first-order object to surface (and manage) uncertainty more effectively for your active projects and portfolios.
While this introduction centered on adding a belief network to an existing, familiar operating model, the real power of the idea kicks in when we extend the belief network into beliefs about:
Industry categories
Customer segments
Market segments
Competitive sets
Internal capabilities
Macro-economic conditions
Our relative priority
Effectiveness of our policies and practices
These will (usually) require us to introduce some new elements into our operating models. But as Roger Martin explains in “A New Way to Think”:
“The only sure way to improve the hit rate of your strategic decisions is to test the logic of your thinking. For your choices to make sense, what do you need to believe about customers, about the evolution of your industry, about competition, about your capabilities? It is critical to write down the answers to those questions because the human mind naturally rewrites history and will declare the world to have unfolded largely as was planned rather than recall how strategic bets were actually made and why. If the logic is recorded and then compared to real events, managers will be able to see quickly when and how the strategy is not producing the desired outcome and will be able to make necessary adjustments.”
We will expand on this idea, and grow the example belief network example, in next week’s newsletter.